A 0.42-inch 72x40 OLED module suits a handheld laboratory instrument precisely because it has no backlight to drive: the pixels emit their own light, so the current the panel needs is the current its lit pixels and its internal charge pump require. That one fact rewrites the power budget. Instead of a fixed backlight overhead that dominates every screen state, you get a load that tracks what you draw, plus a controller such as the SSD1315 that firmware can park between measurements. Design the budget around three measurable states - active update, display-on idle and sleep - and standby behaviour becomes a firmware decision rather than a hardware surprise.
Key takeaways
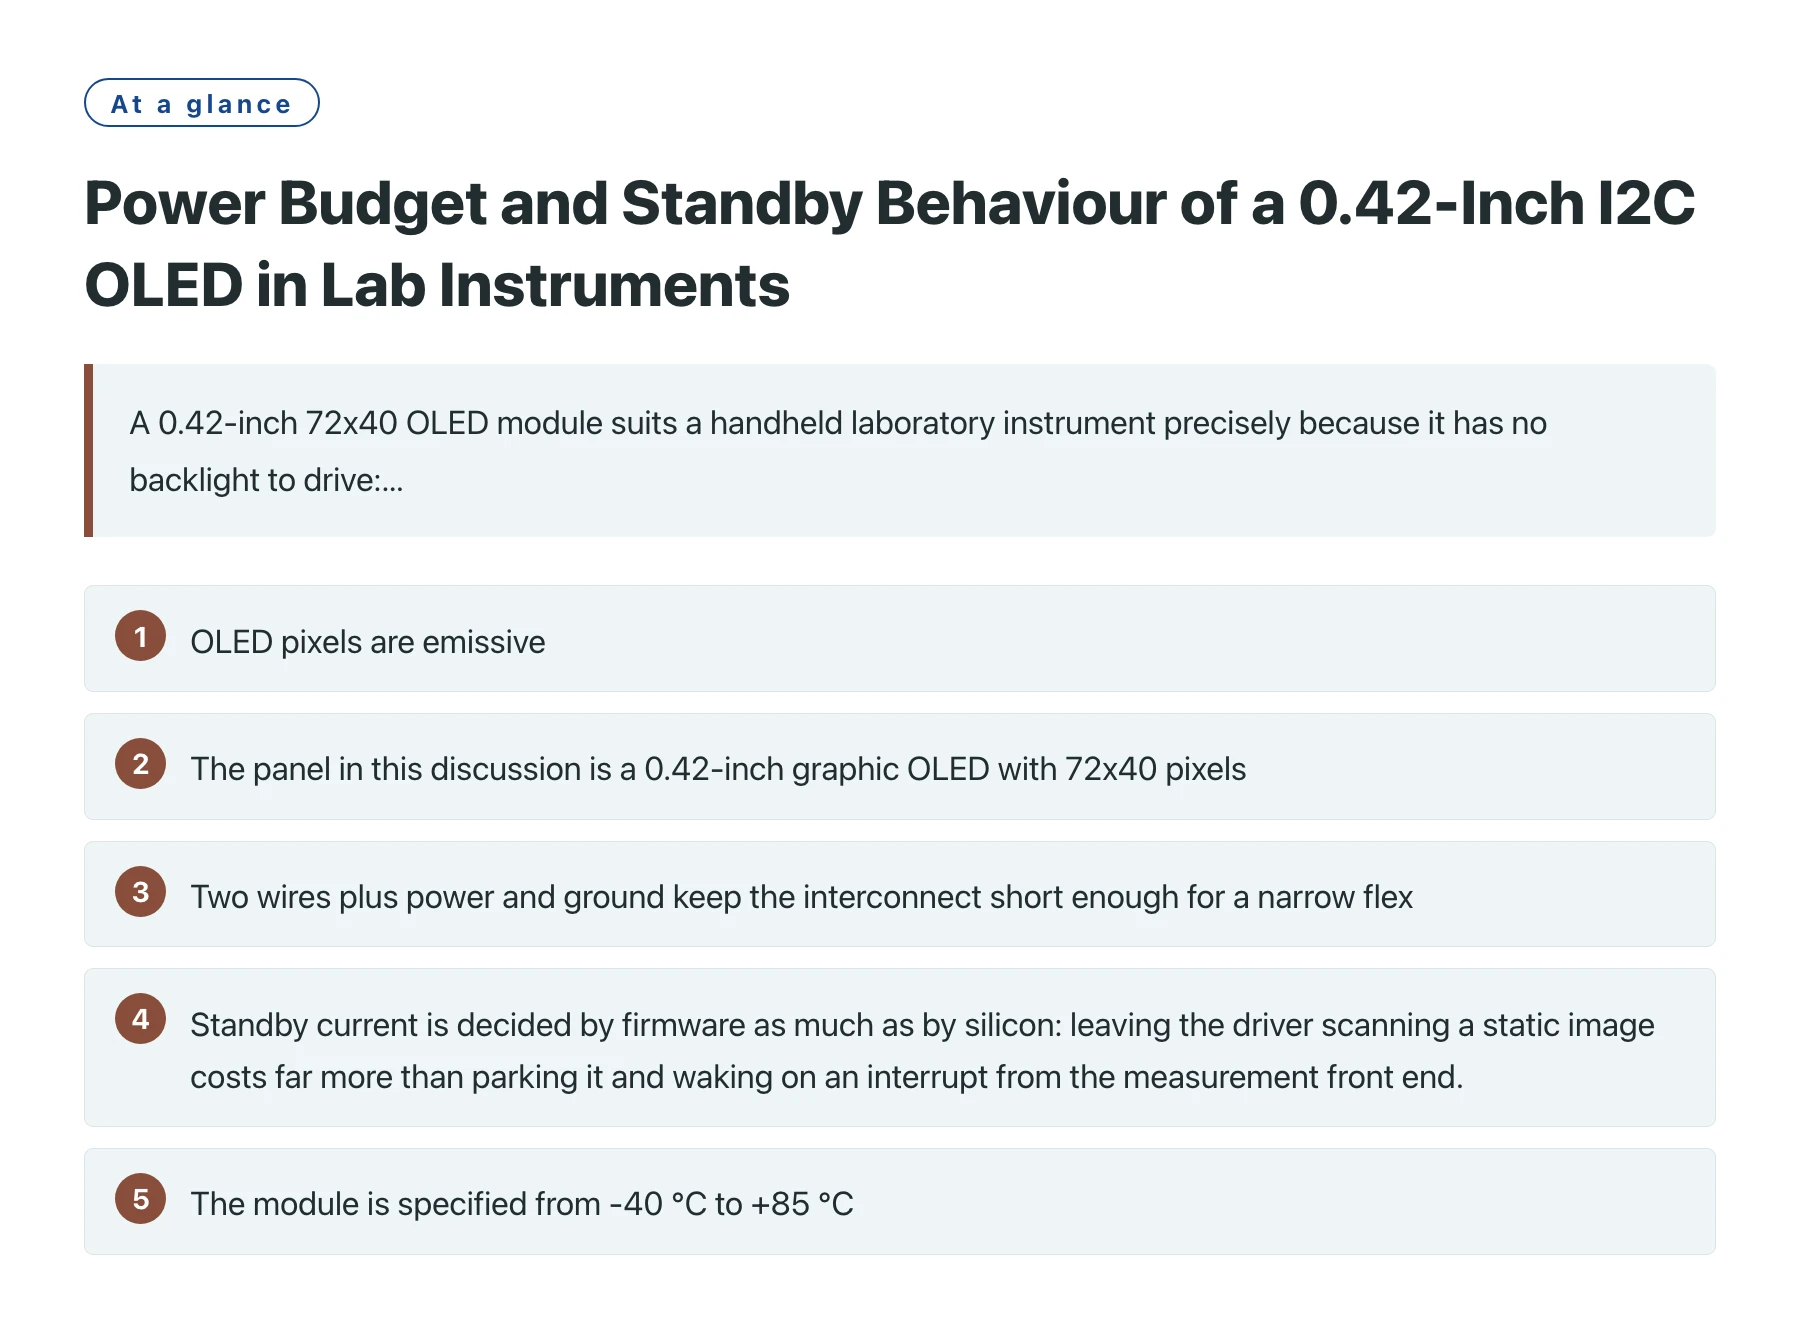
- OLED pixels are emissive, so the panel's current is set by lit-pixel count and refresh activity rather than by a fixed lamp or LED string, and the schematic contains no backlight branch at all. [1]
- The panel in this discussion is a 0.42-inch graphic OLED with 72x40 pixels, an I2C interface and an SSD1315 controller in a 12 x 11 x 1.2 mm outline.
- Two wires plus power and ground keep the interconnect short enough for a narrow flex, which matters more than raw bandwidth for a display that shows a reading, a unit and a status line.
- Standby current is decided by firmware as much as by silicon: leaving the driver scanning a static image costs far more than parking it and waking on an interrupt from the measurement front end.
- The module is specified from -40 °C to +85 °C, so any power figure taken on the bench at room temperature should be repeated at the ends of that window before the budget is frozen.
Laboratory instruments live on a harder duty cycle than consumer gadgets. A handheld pH meter or data logger may sit in a drawer for a week, wake for a ninety-second measurement, then go back to sleep, and on that profile the display is frequently the largest single consumer. How it is driven therefore matters more than the headline quiescent current of the microcontroller, and finding the real numbers early is cheaper than discovering them in a thermal chamber.
The module discussed here is a 0.42-inch OLED graphic display with a 72x40 pixel field, an I2C interface and an SSD1315 controller, packaged in a 12 x 11 x 1.2 mm outline with a wide operating range of -40 °C to +85 °C and low power consumption. Because it is emissive, the usual backlight booster, dimming PWM and current-setting resistor are simply absent; what replaces them is a charge pump inside the driver that generates the panel's internal rail.
What follows is a working method rather than a datasheet recital: the three power states you have to specify, the firmware choices that move current between them, the bring-up sequence that produces figures a reviewer will accept, and the trade-offs against same-size LCD and bistable alternatives.
Where the current actually goes in a sub-inch emissive panel
An OLED pixel emits light when current passes through the organic stack, which is why the technology is described as emissive rather than transmissive. [1] The immediate consequence for a product schematic is that there is no backlight branch: no boost converter, no LED current-setting resistor, and no PWM dimming line running back to the microcontroller.
What replaces the backlight is a charge pump inside the SSD1315 that generates the panel's internal high-voltage rail. That pump runs while the display is active, and it explains why panel current does not fall to zero simply because the image is dark: the driver is still clocking the panel, refreshing its display RAM and holding the rail up.
The second consequence is that average current tracks the number of lit pixels and how often the panel is refreshed. A sparse status screen showing a few digits is a different electrical load from a solid white banner, and both belong in the test matrix. Sparse text is the realistic case for a bench instrument; the full-on field is the case that sizes your decoupling and regulator transient response.
Why a fixed-overhead model misleads you
Teams arriving from LCD designs habitually reserve a constant number of milliamps for the display and then treat it as immutable. With an emissive panel that model errs in both directions: it overstates consumption for a sparse interface and understates peak current when the driver charges its pump while writing a large frame. Budget a peak, an average for the real interface and a sleep figure instead of one number.
Measure at the module pin, not at the wall
Insert a current-sense shunt in series with the display supply and trigger a scope on the I2C clock. A burst pattern appears: a short high-current window while a frame is written, then a much lower floor while the panel holds an image. The peak sizes your decoupling and regulator transient response; the average sizes your battery. Mixing the two up is the most common way a runtime estimate goes wrong.
The question to answer first is not how much the display costs, but what fraction of the time it is doing work.
Firmware choices that move current between power states
| Design choice | What it changes electrically | Where it bites in a battery instrument |
|---|---|---|
| Display-off command | Stops driving the panel while retaining the display RAM contents | Wake must be fast enough that the reading is on screen before the operator looks away; verify the restore path on hardware, not in simulation |
| Pump-off or deep-idle path | Removes the internal rail drive as well as the panel scan, where the register set exposes such a mode | Longer wake latency and a defined re-initialisation sequence; treat it as a real state in the firmware machine, not an afterthought |
| Windowed or partial updates | Reduces the number of refreshed rows and the bytes pushed over the two-wire bus | Requires a dirty-region tracker in the graphics layer, otherwise every small change degenerates into a full-frame write |
| Lower contrast or pre-charge setting | Reduces peak current per lit pixel at the cost of optical output | Useful in a darkened laboratory, but define a minimum readable level and check it again after a cold soak |
| Slower update cadence | Fewer refreshes per second lower the average with no visible change for static text | A one-hertz status update is invisible to the user; redrawing a static screen at video rates is pure waste |
| I2C clock rate | Sets how long the active window lasts for a given frame size | Rise time and total bus capacitance, not the controller, set the practical ceiling on a long flex |
Bring-up measurements that survive a design review
I2C is a multi-drop, addressed serial bus with open-drain signalling, so bus idle current is not automatically zero: the pull-ups conduct only when a device pulls a line low, which means a stuck-low line or an oversized pull-up shows up as an unexplained standby drain. [2] On a module this compact the interconnect is short, so the usual fault is pull-ups that are too strong rather than too much capacitance. Measure the bus with the panel asleep and the microcontroller in its lowest-power mode.
Separate the three states physically before writing them down. Active update means the moment a frame is written; display-on idle means the panel is scanning a static image with no bus traffic; sleep means the driver has stopped and the microcontroller is parked. Record all three together with the supply voltage and the ambient temperature at which they were taken, because a number without those two conditions cannot be compared with anything.
Then repeat the interesting cases at the temperature extremes. A rating of -40 °C to +85 °C describes what the assembly is specified to do across that window; it is not a claim about current. A module this small has no room for bulky energy storage, so most of the capacitance is ceramic and the temperature effects appear in pump behaviour, panel efficiency and oscillator accuracy rather than in a wear-out mechanism.
A standby figure is only useful if it states the state, the voltage and the temperature it was measured at.
A sequence for producing a credible standby figure
- Instrument the supply branch first. Break the display supply and insert a shunt sized for the peak rather than the average, then power the instrument from a source that can resolve the sleep current without changing it.
- Give the firmware a state pin. Toggle a spare GPIO at every transition between active update, display-on idle and sleep, so the scope traces can be labelled instead of guessed at during analysis.
- Sweep content, not just the clock. Capture an all-pixels-off field, the real user interface and a full-on field; the spread between those three captures is the shape of your average-current model.
- Capture the bus at the same time. Trigger on the clock line and look for current bursts with no corresponding frame write; those are usually driver refresh activity or an initialisation the firmware repeats more often than intended.
- Repeat at both temperature extremes. Run the same captures at the cold and hot ends of the operating range and keep the worst average, not the room-temperature one, in the budget. [3]
A display that holds an image is not the same thing as a display that is off. Keeping the driver scanning a static screen is the most common hidden drain in battery instruments, because the firmware looks idle and nothing on the front panel appears to change. If a reading will sit there for minutes, park the driver and wake it on the next user action or measurement, then measure the restore latency so the interface still feels immediate.
Choosing this panel against the same-size alternatives
At 12 x 11 x 1.2 mm the module fits beside a rotary encoder without a mechanical redesign, and the 72x40 pixel field is enough for numeric readout rather than graphics. With a common 6x8 pixel font cell that works out to twelve characters across and five rows, which suits a reading plus a unit and a status line, and does not suit trend plots. Decide the content before you decide the glass.
Interconnect is the second criterion. Two signals plus power and ground fit on a narrow flex and leave the microcontroller's SPI peripheral free for an SD card or an external converter, which is often the deciding factor in a compact instrument. The trade-off is throughput: a 72x40 monochrome frame is small, so the bus rarely limits status text, but a fast animated indicator will feel the difference between the two interfaces.
The alternatives each solve a different problem. A same-size LCD needs a backlight path, which means a boost converter, a dimming control and a diffuser, all of which consume board area and add a fixed overhead to every screen state. A bistable display can hold an image with no power at all, which is attractive for a shelf-mounted logger, but its update is slow and it depends on ambient light to be read. For a dark bench, a short measurement window and a cold room, the emissive panel is the simpler electrical design.
Where the interface is a handful of numbers rather than a graph, a compact part such as the 0.42" I2C OLED display module keeps the front panel thin and the schematic short, and the effort that would have gone into backlight current control can be spent on the measurement chain instead.
Sources
Frequently asked questions
Does a 0.42-inch OLED module need a backlight driver or a dimming PWM?
No. OLED pixels emit their own light, so there is no backlight branch to drive and no lamp current to program. The power path is the module supply plus whatever internal charge pump the driver uses to generate the panel rail. If you want brightness control, you change the driver's contrast or pre-charge setting in firmware rather than adjusting a backlight current.
How should I budget standby current for an instrument that sleeps between measurements?
Split the budget into active update, display-on idle and sleep, then measure each one instead of estimating it. In well-written firmware the dominant sleep term is usually the microcontroller's low-power mode plus regulator quiescent current, with the display contributing only while its driver is still scanning. Check that the I2C pull-ups and any level shifter are not leaking on an idle bus, and confirm the total at the temperature extremes you actually ship to.
Why does the current draw change with what is displayed on an OLED?
Because the light comes from the pixels themselves: a lit pixel draws current and an unlit pixel does not, so a sparse status screen is a lighter load than a solid white field. That is the opposite of an LCD, where the backlight consumes roughly the same power whatever the image. It makes a full-on screen a useful worst case, and it rewards interface designs built from a dark background and a few bright characters.
Can the display share a rail with the instrument's measurement front end?
Usually yes, provided the module's specified supply range covers that rail, but sharing a rail is not the same as sharing noise. A panel writes in short current bursts, so decouple locally and consider a small series ferrite or an RC filter between the display branch and any high-impedance analogue node. Verify it with the converter running at full rate while the display updates, because coupling problems usually appear as a noise floor that moves with screen content.